Quotient: Difference between revisions
(updates from Blockument) |
(Marked this version for translation) |
||
| Line 2: | Line 2: | ||
<translate> | <translate> | ||
<!--T:3--> | |||
<section begin="image"/>[[File:quotient.png|alt=The Quotient Block|thumb]]<section end="image"/> | <section begin="image"/>[[File:quotient.png|alt=The Quotient Block|thumb]]<section end="image"/> | ||
==Usage== | ==Usage== <!--T:4--> | ||
<!--T:2--> | <!--T:2--> | ||
<p id="tooltip">Returns the quotient of two inputs.</p> | <p id="tooltip">Returns the quotient of two inputs.</p> | ||
==Syntax== | ==Syntax== <!--T:5--> | ||
<!--T:6--> | |||
Inputs in this block: | Inputs in this block: | ||
#a number | #a number | ||
| Line 16: | Line 18: | ||
the first value will be divided by the second. | the first value will be divided by the second. | ||
==Example== | ==Example== <!--T:7--> | ||
<!--T:8--> | |||
[[File:quotient_example.gif|alt=Quotient example gif|thumb]] | [[File:quotient_example.gif|alt=Quotient example gif|thumb]] | ||
[[File:quotient_example.png|alt=Quotient example code|thumb]] | [[File:quotient_example.png|alt=Quotient example code|thumb]] | ||
<!--T:9--> | |||
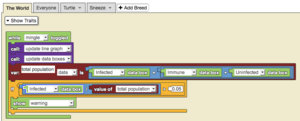
This is a model of an epidemic. To monitor the spread of the epidemic, data boxes and a line graph have been employed to monitor immune, uninfected, and infected populations. An epidemic occurs when the infected population exceeds the expected infected population. When over 5% of the population is infected, the warning label is shown. | This is a model of an epidemic. To monitor the spread of the epidemic, data boxes and a line graph have been employed to monitor immune, uninfected, and infected populations. An epidemic occurs when the infected population exceeds the expected infected population. When over 5% of the population is infected, the warning label is shown. | ||
==Related Blocks== | ==Related Blocks== <!--T:10--> | ||
<!--T:11--> | |||
*[[Special:MyLanguage/Product|Product *]] | *[[Special:MyLanguage/Product|Product *]] | ||
*[[Special:MyLanguage/Sum|Sum +]] | *[[Special:MyLanguage/Sum|Sum +]] | ||
Latest revision as of 16:00, 14 August 2023
Usage
Returns the quotient of two inputs.
Syntax
Inputs in this block:
- a number
- a number
the first value will be divided by the second.
Example
This is a model of an epidemic. To monitor the spread of the epidemic, data boxes and a line graph have been employed to monitor immune, uninfected, and infected populations. An epidemic occurs when the infected population exceeds the expected infected population. When over 5% of the population is infected, the warning label is shown.

