Data Box/en: Difference between revisions
(Updating to match new version of source page) |
(Updating to match new version of source page) |
||
| (4 intermediate revisions by the same user not shown) | |||
| Line 3: | Line 3: | ||
<section begin="image"/> | <section begin="image"/> | ||
[[File:Data box.png|alt=Data box|thumb]] | [[File:Data box.png|alt=Data box|thumb]] | ||
<section end="image" /> | <section end="image" /><p id="tooltip">Returns the value of a selected data box.</p> | ||
<section begin="name" />{{Block|[▼] data box}}<section end="name" /> is a code block from the [[Interface]] drawer. | <section begin="name" />{{Block|[▼] data box}}<section end="name" /> is a code block from the [[Interface]] drawer. | ||
==Usage== | ==Usage== | ||
{{Block|[▼] data box}} refers to the value of a selected data box. | |||
<strong>Note:</strong> You should use data boxes for numerical values and labels for textual values. One advantage of using a data box is that you can title it. | |||
==Syntax== | |||
[[File:DataBox Nums.png|right|alt=The Data Box Block|thumb]] | |||
<!-- <code>[Dropdown: Data Box Widget] data box</code> --> | |||
Input: | |||
#a data box from the dropdown menu | |||
==Example== | |||
[[File:data_box_example.gif|alt=Data Box example gif|thumb]] | |||
[[File:quotient_example.png|alt=Data Box example code|thumb]] | |||
This is a model of an epidemic. To monitor the spread of the epidemic, data boxes and a line graph have been employed to monitor immune, uninfected, and infected populations. An epidemic occurs when the infected population exceeds the expected infected population. Thus, when over 5% of the population is infected, the warning label is shown. | |||
==Nuances== | ==Nuances== | ||
Latest revision as of 15:53, 16 August 2023
Returns the value of a selected data box.
[▼] data box is a code block from the Interface drawer.
Usage
[▼] data box refers to the value of a selected data box.
Note: You should use data boxes for numerical values and labels for textual values. One advantage of using a data box is that you can title it.
Syntax
Input:
- a data box from the dropdown menu
Example
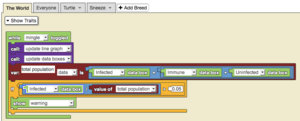
This is a model of an epidemic. To monitor the spread of the epidemic, data boxes and a line graph have been employed to monitor immune, uninfected, and infected populations. An epidemic occurs when the infected population exceeds the expected infected population. Thus, when over 5% of the population is infected, the warning label is shown.


